


Platform Interface
USING THE PLATFORM
-
Understanding the navigation panel
The main Navigation Panel is how you will move around the platform and access the various features you have access to.
The Navigation Panel is located down the left-hand side of your screen at all times. It’s accessible regardless of where you are in the platform, and you will use the Navigation Panel to move from module to module.
Here are some key things to remember:
- The number of modules you have access to will depend on the level of access you have. If your current software package provides you with access to some of Intelligence Fusion’s Premium Features, you’ll see more modules and icons in your Navigation Panel.
- Hovering over each icon in your Navigation Panel will reveal a label informing you of the module name.
- Clicking on any of the icons will open up a sub-menu with further module features and options. Again, each of these can be identified by hovering your mouse over the icon.
- You can close the sub-menu at any time by clicking on the icon in the main Navigation Panel again.
- You will know which module you’re currently in at all times, as there will be a green and blue vertical bar highlighting which module you’re working from.
-
Using the location search
The Location Search allows you to quickly and easily pinpoint a specific location on the map interface.
The Location Search can be found in the top left-hand corner of the main map interface, which can be accessed through the Intelligence Feed module.
You can use this search functionality to quickly locate an asset, city, town, landmark or region on the map.
- The icon will look like a magnifying glass with a map pin. Click on this to open the search box.
- Start typing in your location – this code be a postal or zip code, a city, town or village, or even a specific address, street name, or landmark. You can also use lat/long coordinates to search for a precise location.
- A dropdown box of suggested/related locations will appear as you type.
- Select the correct option from the dropdown.
- The map will zoom in on the correct location. If you’re looking for a specific building or have used coordinates to search, the exact location will be identified by a blue dot on the map.
- To close the search box, click the magnifying glass icon again.
There’s also a icon designed to look like a target top the right of the search box, which will appear when you open the Location Search. This allows you to zone in on your current location on the map.
Your browser will first prompt you to share your location. You’ll need to allow these permissions in order to use this feature.
-
Using the map key
This article will help you understand how to use the Map Key, and when you’ll find it useful.
The Map Key can be accessed in the bottom right-hand corner of the Navigation Panel at all times.
Intelligence Fusion defines incidents using:
- 11 Categories
- 159 Incident Types
The Map Key will therefore provide you with context around the iconography and different colored pins we use to categorize incidents on the map.
- Click on the Map Key icon on the main Navigation Panel to open up the key.
- Initially, you’ll be presented with a list of the 11 categories. You can click on each category to reveal the incident types within it.
- Each incident type has its own icon.
- You’ll also find a search box at the top of the Map Key that you can use to search for specific incident types – please note, that you cannot filter incidents using the Map Key.
- The Map Key is used purely for reference and context. If you’d like to filter and find relevant incidents, head to this section of our Knowledge Base.
-
Accessing the overview dashboard
In addition to pins on a map, you can visualise the data in other ways – including an Overview Dashboard. Here’s how you can access it.
The Overview Dashboard can be accessed from the main Navigation Panel. It provides you with an alternative way to view elements of the platform including incidents, statistics, watched incidents, and themes.
- To access the dashboard, click the Overview icon under the Organisation module on the main Navigation panel.
- This will open up your dashboard. You’ll be able to see the following:
-
- Recently Reported Incidents: A dynamic list of incidents reported in the last 24 hours
- Incidents Statistics: General statistics based on our daily, weekly, and monthly reporting
- Watched Incidents: An easy-to-access list of your watched incidents
- Trending Themes: A list of the most commonly used and recently added to themes
CUSTOMIZING THE MAP
-
How to turn on/off the incident overlay
Turning on and off the incident pins in order to customize your view of the map interface.
- In the main Navigation Panel, there is a module called Overlays – click this to further customize your view.
- Once clicked, a sub-menu will appear with several options depending on your level of access and the Premium Features you have activated on your account.
- Regardless of your access, everyone will see Incidents and Static Assets as options.
- Clicking the Incidents icon will turn the incident overlay off. Clicking it again will reactivate the overlay.
Overlays are active when they are highlighted in blue.
-
How to turn on/off the static asset overlay
Turning on and off your static assets in order to customize your view of the map interface.
- In the main Navigation Panel, there is a module called Overlays – click this to further customize your view.
- Once clicked, a sub-menu will appear with a number of options depending on your level of access and the Premium Features you have activated on your account.
- Regardless of your access, everyone will see Incidents and Static Assets as options.
- Clicking the Static Assets icon will turn the asset overlay off. Clicking it again will reactivate the overlay.
Overlays are active when they are highlighted in blue.
-
How to cluster incidents
You can customize how you visualize incidents on the map by clustering icons, or viewing them individually – here’s how.
- Navigate to the Map Options feature in the bottom right-hand corner of the map.
- Click on the Map Options.
- A list of options will appear including Show Clusters and Show Separate
- Clicking on Show Clusters will group incidents together, rather than displaying them as individual icons.
- You can zoom in and out of the map to get a more granular view of the incident data
- Click Show Separate to view incidents as individual icons
-
How to change the mapping style
Customize your view of the map with a selection of map styles.
There are currently four available map styles that you can switch between, depending on your preference and how you would like to view the data. You can also set a default view for your account.
- In the bottom right-hand corner of the main interface, you’ll see an icon that looks like a map.
- Click on this button to open your map style options.
- You’ll see four styles: Dark, Streets Satellite, or Hybrid.
- You can switch map styles by clicking on any of the options.
- Set a default map style by selecting Set as Default next to your preferred style.
-
How to change the perspective of the map
the map.
You can change the perspective of the map at any time, and on any map style too.
- Hold down the CTRL key on your keyboard.
- Drag the map to change the perspective.
- To reset your perspective, use the compass icon in the bottom right-hand corner of the map, under the zoom-in and out buttons.
- You can also reset the zoom using the icon directly below the compass.
Intelligence Feed
FILTERING INCIDENTS
-
How to use the basic filters
The Incident Filter feature allows you to perform searches on our dataset and identify incidents that are most relevant to your business and operations.
The basic filters consist of the most commonly used filters and are typically used to perform quick, high-level searches of the database. Once you’ve built out some Basic Filters, you can save your search and turn on notifications for the criteria that you’ve set.
- To access the Basic Filters, you first need to navigate to the Incident Feed module. This is the first option available in the navigation panel. It is the main mapping interface for our software.
- A second panel will appear providing you with access to further functionality within the Incident Feed module. If you have access to the Reporting Incident feature, this will be the first option and the Incident Filter feature will be the second. If you don’t have access to Reporting Incidents, you’ll find the Incident Filter feature at the top of your list.
- Click the Incident Filter button to open the filtering panel.
- As default, the panel should already open on the Basic Filter option.
- From here, you can select from several options to begin narrowing down your search. Your options will include:
-
- Search: Use keywords or phrases to filter for relevant incident data. For example, typing “Brexit” will filter for any incidents that include this keyword.
- Type: This allows you to filter for specific types of incidents, such as Armed Robbery, Hurricane, or, Planned Demonstration. You can see the full list of Incident Categories and Types here.
- Date: Further narrow your search by selecting a date range. You can filter for incidents that occurred between two particular dates, that occurred before a certain date, or even after a specific date.
- Country: You can select one or more countries to refine your search.
- Continent: You can also filter by one or more continents.
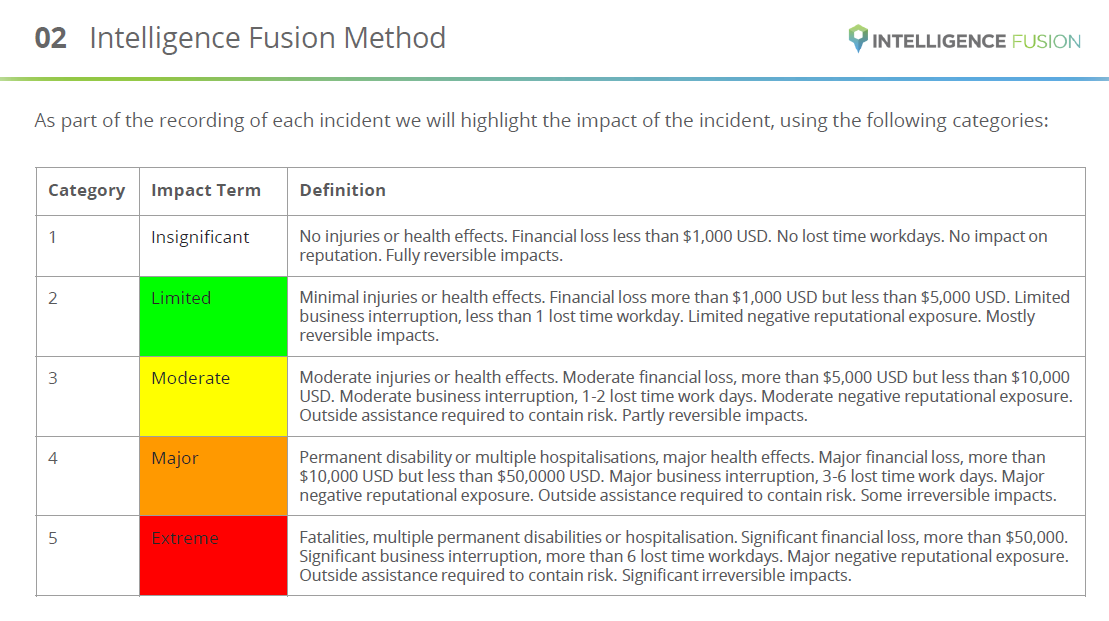
- Impact: Every incident is given an impact rating – insignificant to extreme. This filter allows you to filter for incidents of a certain severity. The Impact Rating definitions can be found here.
- Ongoing: You can select all events, ended or ongoing events
- Watching: Select all events, watching or not watching events
-
- As you filter, the map will start to narrow down the dataset and return results based on your criteria. From here, you can take some additional actions:
-
- Clear: Clears the current filter
- Save: Save your search results, which you can use to activate notifications. Learn more about saving filters and turning on alerts here.
- PDF: You can export your search as a PDF document, this will only export the last 250 incidents from your search.
- CSV: You can also export as a CSV. This format allows you to download the latest 1,000 incidents.
-
Remember, the map will show a maximum of 10,000 incidents at any one time. So if your search criteria exceed this limit, you won’t see all of the incidents available within our dataset.
-
How to use the advanced filters
The Incident Filter feature allows you to perform searches on our dataset and identify incidents that are most relevant to your business and operations.
The Advanced Filter provides you with much more granularity compared to the Basic Filter functionality and is typically where our clients will start to build out specific searches for which they’d like to receive alerts.
Once you’ve narrowed down the Incident Feed using the Advanced Filters, you can save your search and turn on notifications for the criteria that you’ve set.
- To access the Advanced Filters, you first need to navigate to the Incident Feed module. This is the first option available in the navigation panel. It is the main mapping interface for our software.
- A second panel will appear providing you with access to further functionality within the Incident Feed module. If you have access to the Reporting Incident feature, this will be the first option and the Incident Filter feature will be the second. If you don’t have access to Reporting Incidents, you’ll find the Incident Filter feature at the top of your list.
- Click the Incident Filter button to open the filtering panel.
- As default, the panel will open on the Basic Filter option. You’ll need to select the second tab to open the Advanced Filter.
- From here, you can select from a range of options to narrow your search. Start by clicking on the “Select Filters” button at the top of the panel. This will produce a list of possible filters. Your options will include:
- Search: Use keywords or phrases to filter for relevant incident data. For example, typing “Brexit” will filter for any incidents that include this keyword.
- Category:You can filter for an entire category or set of icons such as Criminality, Protest or Hazards. You can see the full list of Incident Categories and Types here.
- Type: This allows you to filter for specific types of incidents, such as Armed Robbery, Hurricane or Planned Demonstration. You can see the full list of Incident Categories and Types here.
- Reported Date: Further narrow your search by selecting a date range. You can filter for incidents that were reported between two particular dates, that occurred before a certain date, or even after a specific date.
- Started Date:This allows you to filter for incidents that occurred within a particular date range. This can often be useful to see upcoming protests and other incidents that are planned and yet to take place.
- Ended Date: Often, incidents can be ongoing for days. This filter allows you to select a date range for incidents that ended in that time period.
- Country: You can select one or more countries to refine your search.
- Continent: You can also filter by one or more continents.
- Impact: Every incident is given an impact rating – insignificant to extreme. This filter allows you to filter for incidents of a certain severity. The Impact Rating definitions can be found here.
- Ongoing: You can select all events, ended or ongoing events.
- Watching:You can select all events, watching or not watching events.
- Theme: You can filter by themes, such as Russia Ukraine Conflict or COVID-19 Pandemic, to see all incidents associated with that trend or pattern.
- Tagged: Tags are keywords that we associate with each incident to help you find relevant data much more efficiently. For example, the tag “terrorism” will be assigned to any incident relating to terror activity.
- Involving: This filter allows you to drill down into activity relating to certain groups or parties, such as terror-related groups, extremist groups, or activist groups as well as brands, organizations, and individuals.
- Affected Sectors: Within each incident, you’ll see be able to see the sectors that were impacted as a result of this incident, so you can start to drill down into data that is most relevant to your industry. You can see the full list of Affected Sectors here.
- Draw Area: Use the draw area functionality to geofence around a specific area such as a town or city, or create your own region by freely drawing on the map.
- Reported by you: Select all events, reported by us or reported by your organization. This is a premium feature – you can find out more about this functionality here.
- Static Assets Searches: You can filter for incidents that occur within a certain radius of your static assets. To learn how to plot, manage and set up alerts for your assets, head to this article.
The Advanced Filter also provides you with the option to “exclude” certain filters from your search. When the toggle to the right of the filtering option is green, this is including that criteria in your search. Clicking on the toggle, it’ll turn white, meaning that it’s being excluded from your search results.
As you filter, the map will start to narrow down the dataset and return results based on your criteria. From here, you can take some additional actions:
- Clear: Clears the current filter
- Save:Save your search results, which you can use to activate notifications. Learn more about saving filters and turning on alerts here.
- PDF: You can export your search as a PDF document, this will only export the last 250 incidents from your search.
Remember, the map will show a maximum of 10,000 incidents at any one time. So if your search criteria exceed this limit, you won’t see all of the incidents available within our dataset.
-
Using the draw area tool
The Draw Area filter gives you the functionality to geofence around a custom area of interest, allowing for another level of granularity when searching for the incidents that are most impactful to you and your organization.
The Draw Area filter can be found in the Advanced Filter section of the platform.
- Once you have navigated to the Advanced Filter section of the platform, click Select Filters and scroll until you find Draw Area.
- Click on the Draw Area filter.
- You will now be presented with an option within the Advanced Filter panel called Add Area – click this button.
- You will notice that your cursor has now changed to a cross.
- Use the Location search in the top left-hand corner of the screen, or use your mouse to zoom into the area you’d like to geofence.
- To start drawing, click on the map to begin adding markers. A pop-up will appear that allows you to delete your markers, begin again or complete your area.
- Once you’re happy with the area you’ve drawn, select the checkmark button to complete.
- You can still edit your area after you have finished, you can move points by simply clicking and dragging a marker. You can add an additional marker by clicking anywhere on the map and you can remove a marker by double-clicking on a marker.
-
Filtering for static assets
The Static Asset Search filter allows you to visualize incidents that have occurred within a specified radius of any assets that you have plotted on the map. This article will show you how the “Static Asset Searches” filter can be used to do this.
Firstly, however, you will need to create some Static Asset Searches if you have not already. You can read about how to do that here.
Once you have saved your relevant Static Asset Searches, you can filter for them in the Advanced Filter section of the platform. If you’re yet to explore the Advanced Filter functionality, you can check it out here.
- Navigate to the Advanced Filter section of the Incident Filter panel, click Select Filters and scroll until you find the Static Asset Searched option.
- Click on the Static Asset Searches filter.
- In the first box, you can select any of your saved Static Asset Searches. A drop-down box will appear with your saved options.
- Once you’ve selected your relevant search, you can specify the radius in the box to the right. NOTE: The distance is set to kilometers.
- You can continue to filter your data set by adding additional filters. Click on Select Filters again to start further narrowing down your search.
- As you add filters, the map will start to narrow down the dataset and return results based on your criteria. From here, you can take some additional actions:
- Clear: Clears the current filter
- Save: Save your search results, which you can use to activate notifications. Learn more about saving filters and turning on alerts here.
- PDF: You can export your search as a PDF document, this will only export the last 250 incidents from your search.
- CSV: You can also export as a CSV. This format allows you to download the latest 1,000 incidents.
Remember, the map will show a maximum of 10,000 incidents at any one time. So if your search criteria exceed this limit, you won’t see all of the incidents available within our dataset.
-
How to save your filters
Saving filters allows you to turn on notifications for certain criteria. It also provides you with an easy way to activate alternative views and drill down into relevant data quickly.
You can create filters using the Basic or Advanced filtering options in the Incident Filter Panel. If you need some help doing this, you can head to this article.
- As you add filters, the map will start to narrow down the dataset and return results based on your criteria. From here, you can take some additional actions:
- Clear: Clears the current filter
- Save: Save your search results, which you can use to activate notifications. Learn more about saving filters and turning on alerts here.
- PDF: You can export your search as a PDF document, this will only export the last 250 incidents from your search.
- CSV: You can also export as a CSV. This format allows you to download the latest 1,000 incidents.
- To save your filter, click on the Save button.
- You’ll then be presented with an option to name your filter. We recommend that you give the filter a relevant and descriptive name.
- Then, click Save Filter.
- To view your saved filters, there is a third tab named ‘Saved’ in the Incident Filter Panel that houses all of your saved searches. Here, you can also turn on notifications or activate your saved filters.
- As you add filters, the map will start to narrow down the dataset and return results based on your criteria. From here, you can take some additional actions:
-
How to edit your saved filters
If you need to make a change to a saved filter, this article will show you the easiest way to do so on the platform.
- Navigate to the Saved tab of the Incident Filter panel.
- Identify the saved filter you’d like to edit
- Activate that filter using the tick or checkmark icon to the right of the filter name.
- Once your filter has been activated and the data is loaded, click on the Advanced tab of the Incident Filter panel.
- You will now see the criteria you built to create that saved filter.
- Add new filters or edit your existing ones in the Advanced panel.
- Click Save and rename your filter. Please note, this will save your updated criteria as a new saved filter – you will need to delete the old saved filter if you no longer need it – you can learn how to delete a saved filter here.
- Don’t forget to activate notifications for the new saved filter if you require alerts.
-
How to delete your saved filters
If you no longer need a saved filter, you can remove it from your Saved panel. Please note that this action cannot be undone.
- Navigate to the Saved tab of the Incident Filter panel.
- Identify the saved filter you’d like to edit
- You’ll see an icon made of three vertical dots to the right of the filter name.
- Click the three dots
- You will see the Remove Filter option – click this button.
- You’ll be presented with a box to confirm the deletion of your Saved Filter.
- Click Remove Filter to confirm.
VISUALIZING INCIDENTS
-
Using the incident list panel
Our map-based software provides you with a highly-visual way to view and interrogate the data, but there are other ways you can visualize our incidents too.
The default view when you log in to the platform is the map. You can interact with individual incident icons on the map at any time, however, you can also view incidents in a list format. To do this, you’ll need to open the Incident List Panel.
- On the left-hand side of the platform is the main navigation panel, and the first icon in the list is the Incidents module.
- Click the Incident icon. A new panel will appear giving you access to the Incident module functionality. Your options in this panel will depend on your access level as part of your subscription.
- The Incident List Panel icon is likely to be the second or third option. Hovering over each icon will inform you of the functionality.
- Select the Incident List Panel.
- The panel will appear, and the incidents included in this view will reflect the filter that you have activated at that time. If you’re yet to learn how to build, save and activate filters, head to the Filtering Incidents section of our Knowledge Base.
- Click the Expand icon in the top right if you’d like to make the Incident List Panel fullscreen.
- Click the ‘X’ in the top right to close.
- Across the top of the panel, you have two options: Sort and Options
USING SORT
Once clicked, a dropdown box of options will appear. Sort the data in your preferred way; by oldest, newest, by type or even by incidents that are still ongoing.
USING OPTIONS
Options allows you to customize your view further.
- Click ‘Only show what appears on the map’ to make the Incident List Panel reflect the area you’re currently zoomed into on the map.
- Click ‘Compact view’ to remove the individual incident icons and view more incidents at any one time.
-
Generating statistics
Using the Statistics Tool, you can easily generate statistics based on the data you’re currently filtered for on the map. This provides you with a quick and insightful way to understand the most common type of threat.
- On the left-hand side of the platform is the main navigation panel, and the first icon in the list is the Incidents module.
- Click the Incident icon. A new panel will appear giving you access to the Incident module functionality. Your options in this panel will depend on your access level as part of your subscription.
- The Statistics Panel icon is likely to be the third or fourth option. Hovering over each icon will inform you of the functionality.
- Select the Statistics Panel.
- The panel will appear, and the statistics that are automatically generated in this view will reflect the filter that you have activated at that time. If you’re yet to learn how to build, save and activate filters, head to the Filtering Incidents section of our Knowledge Base.
- Click the Expand icon in the top right if you’d like to make the Statistics Panel full screen.
- Click the ‘X’ in the top right to close.
- Across the top of the panel, you have further options to drill down into the data, including the ability to view statistics based on categories, types, continents, countries, and sectors.
-
Using the themes tool
The Themes tool provides you with a way to visualize trends and patterns within the dataset.
You can view Theme data as individual incident or as a heatmap. You can also turn on notifications for any Themes that you may be interested in following more closely – you can do this in the Advanced Filter panel.
- On the left-hand side of the platform is the main navigation panel, and the first icon in the list is the Incidents module.
- Click the Incident icon. A new panel will appear giving you access to the Incident module functionality. Your options in this panel will depend on your access level as part of your subscription.
- The Themes Panel icon is likely to be the last option in the list. Hovering over each icon will inform you of the functionality.
- Select the Themes Panel.
- A list of the available Themes will be displayed in the panel.
- You can very quickly filter for all of the incidents associated with a theme of interest by selecting the ‘View on Map’ icon to the right of the theme. Clicking on the name of the theme will also activate the incident view.
- You can also activate a heatmap overlay for each theme by clicking the ‘Show Heatmap’ icon to the right of the theme.
- You can open up the full Theme Profile by selecting the ‘View Theme Details’ icon to the right of the theme.
- Click the Expand icon in the top right if you’d like to make the Themes Panel full screen.
- Click the ‘X’ in the top right to close.
- Across the top of the panel, you have two options: Filter and Sort
USING FILTER
Filter allows you to drill down into the available themes to help you find what you’re looking for. Click Filter to show a dropdown box of your option.
- You can search for themes, just start typing and any matching themes will start to appear in the list.
- You can also filter by ‘Trending’ themes – the most active/recently added to.
USING SORT
Once clicked, a dropdown box of options will appear. Sort the data in your preferred way; by oldest, newest, highest or lowest casualty count or even most recently added to.
-
How to identify and monitor Emerging Threats
How to find, use and get the most value out of the Emerging Threats feature.
The Emerging Threats feature is located within the Incidents panel on the left-hand side of the platform, below the Themes icon. This will open a panel on the left-hand side (like the incident list panel), which will showcase all our Emerging Threats.
Our Emerging Threats are situations that our analysts have identified as having a significant probability of materializing into an active threat.
The main benefits of the Emerging Threats feature include:
- Being able to have foresight on situations that can turn into significant threats in the near future
- Being able to mitigate threats that may impact your assets, people, and reputation before they materialize
How to use Emerging Threats?
- Click the Incidents panel at the top of the left-hand-side menu bar
- Click on the Emerging Threats button (below the Themes icon)
- A panel with our Emerging Threats will appear from the left
- The Emerging Threats are listed by start date
- You can watch an Emerging Threat by clicking the ‘Watch’ symbol on the bottom left corner of the incident (the icon that looks like an eye)
- Watched Emerging Threats will appear in your watch incidents list on the platform overview, and you will receive a notification if/when new information is added to the Emerging Threat
- You can view an Emerging Threat in more detail by clicking the ‘Incident Details’ button on the bottom right corner of an incident (the icon that looks like a page and magnifying glass)
- Within the full details of the Emerging Threat, you will be able to see if that incident has materialized into an actual threat by looking at the Linked Incidents section
- I.e. The Emerging Threat is a warning informing you there is potential for conflict/crime/protest or another category type. If this materializes, it will have linked incidents that can be clicked on for more information and a more granular level of detail
-
How to identify trends and patterns over time using the Timeline Tool
How to access, use, and get the most value out of the Timeline Tool
The Timeline Tool is a feature available on your subscription, allowing you to visualise trends more easily. The button to access the feature is in the bottom right-hand corner of the map, above the “Map Options” button. The button will ONLY appear when a new filter has been created or a saved filter has been activated. Activating the Timeline Tool will open a panel at the bottom of the map with a bar graph showing the number of incidents per week or month, dependent on the time frame selected in the filter activated. The visualisation can then be viewed in a dynamic motion by clicking the play button.
The main benefits of the Timeline Tool include:
- Being able to identify trends and patterns of incidents in a set of or a singular country or area over an extended period
- Being able to identify hotspots over time
- Saving time in identifying a trend by not having to continuously change the time frame of a filter to get updated numbers
How to use the Timeline Tool:
- Go to the Incident Filter/Search panel located within the Incidents module
- Create a new filter based on parameters you are interested in, or go to Saved filters and activate a Saved filter
- After the filter is created and the incidents populated, the Timeline Tool icon (in the shape of a clock) will appear at the bottom right-hand corner of the map, above the Map Options button
- If you click the Timeline Tool button, a timeline will appear at the bottom of the map
- Depending on the time frame selected in your filter, the timeline will show incidents per month or per week
- You can visualise the incidents on the map in a dynamic view by clicking the Play button on the left-hand side of the timeline – a Reset button is also located above the Play button if you need to reset the view
- You can close the Timeline Tool by clicking the Timeline button again
While you can use the Timeline Tool with a filter that has no time frame, the timeline may not display accurately if you do, as it will reflect the incidents on the map, which have a limit of 10,000 incidents to be displayed at one time.
REPORTING INCIDENTS
-
Geolocating an incident
How use the geolocation form while reporting your own incidents, and understanding the various tools at your disposal.
When reporting an incident, you will get two mapping screens. The information below is how to use each screen.
The first screen you come across is where you will select how and where you will map your incident. This is how the geolocation will look inside an incident’s details. The screen is made up of several components.
- A ‘Search for Location‘ search bar, where you can type in a location, or put the latitude and longitude coordination of the incident. Typing in the location or putting in the latitude and longitude will make a blue dot appear on the map and zoom in to help you see the location clearer.
- Place, Area and Route buttons, which are options on how you will map your incident on the platform.
- Place: The place button is if you want your incident to be represented by a pin on the map.
- Area: The area button allows you to draw a polygon on the map if your incident impacts a large area (i.e. a storm). The final map marker will be placed in the middle of the polygon but can be moved in the final geolocation screen.
- Route: The route button allows you to draw a singular line with multiple points from A to B. The final map marker will be placed in the middle of the route, but can be moved on the final geolocation screen.
-
How to map your geolocation features on the map?
- Find your location using the search box, by either typing in the address or city, or by using the latitude and longitude coordinates.
- Select whether you want to map your incident as a Place, Area, or Route.
- Place the pin, draw the polygon, or draw the route on the map wherever your incident has taken place.
- When you have placed your geolocation feature on the map, a box will appear. You can fill out the Name, Description, and Colour associated to the feature if you wish. When done, click the checkbox to confirm the feature.
- When you have confirmed the location of the feature, click the Next button in the bottom right-hand corner of the screen. This will take you to the second geolocation screen.
-
What to do on the second geolocation screen?
The second geolocation screen is to confirm the location of the final incident pin that will appear on the global map where all the incidents show.
The pin on the screen will automatically be placed in the same location where you place the pin on the first geolocation screen, or will be located in the middle of the area or route you drew on the first geolocation screen.
If you need to adjust the location of the pin to reflect what you want better, just click on the pin on the screen and drag it where you’d like it located.
When you are done, you can click the Confirm button at the bottom right-hand corner of the screen.
HOW TO REPORT AN INCIDENT
-
Customizing Incidents
Customize your platform to include incidents that matter most to your business. This premium feature allows you and your team to report incidents that impact your business, assets and people. This article will explain how incident reporting works.
Our team of expert analysts work 24 hours per day, monitoring the global threat landscape and prioritizing threats that will impact our client’s operations. Clients are alerted of these incidents, which allows them to act swiftly. Thorough Intelligence Collection Plans (ICPs) formulated with customers during the onboarding process and regularly updated throughout their subscription provide our analysts with the information required to understand your needs.
-
Premium feature to report incident
A premium feature of our platform is the ability to report your own incidents.
- To get started, click the ‘Incidents’ icon at the top of the left-hand menu and then click ‘Report An Incident’ at the top of the sub-menu that appears
- A box will appear on the screen; select ‘Start Draft’ to report a new incident from scratch
- Input an incident type by choosing from the list of categories
- Add your own summary of the incident
- Add a description if you have further details to include
- Select a start and end time/date, or select ongoing
- Add any relevant tags
- Add relevant references to show the source of the information (if applicable)
- Then, click ‘Next’ in the bottom right-hand corner to proceed to the next step
- Add further details such as total casualties, impact rating, involved parties, affected sectors, a narrative or linked incidents to create a more detailed picture of what has happened
- The only mandatory field that must be completed on this page is the impact rating
- Once complete, click ‘Next’ in the bottom right-hand corner of the page
- Select the location where the incident took place. This can be an area, route or a specific location. You can input the latitude and longitude if you know it, or you can just add a rough location and update it later once you have further details
- For example, you may have the postcode or just know the city the incident occurred within; start by typing that in the search bar and then select one of the three icons below
- ‘Place’ allows you to drop a pin in an approximate or exact location
- ‘Area’ allows you to draw a wider area showing where the incident happened. To do this, simply click in various places on the screen to create multiple points which join together to create an area
- ‘Route’ allows you to draw the path of the incident, similar to the area tool. Simply click at various points on the route to draw a line which encompasses the route of the location
- Once happy, you can name the location, add a description and set a colour. To complete this step, click the tick in the bottom right-hand corner of the box
- Once happy, click ‘Confirm’ in the bottom right-hand corner of the screen
- Two boxes will then appear in the bottom right-hand corner of the screen; they will give you the option to report the incident or save it as a draft – select the option you prefer
-
Report by 'cloning'
Another way of reporting your own incident is to ‘Clone’ an existing incident; this can be faster than following the process above. You can do this by following the steps below:
- Select any incident
- Click the three dots in the top right-hand corner of the incident next to the X button
- Select ‘Clone’ and ‘Clone Incident’
- Follow the steps to update any information
- Then select ‘Report Incident’ to save it
Alternatively, you can right-click anywhere on the map to report an incident. This can make geo-locating an incident easier if you know exactly where it has occurred and prefer to input this information first.
————————————————————————————————–
You can view incidents you report in the same way as you would any other incident. Using the filter panel, you can search in various ways to find them, including using the ‘reported by’ option in advanced filters to quickly see all incidents you or your team have reported.
In addition, alerts can be set up, so your team can be made aware when you report an incident within so many miles of one of your assets.
EXPORTING INCIDENTS
-
How to export data into a PDF
Using the Export as a PDF tool provides you with a formatted list of incidents that you can utilize offline.
To start, you’ll need to build a new filter using the Basic or Advanced Filters. You can learn how to do this in the Filtering Incidents section of our Knowledge Base.
Alternatively, you can export the data from an existing Saved Filter.
Exporting from new:
- Build out your filter criteria until you’re happy with the dataset shown on the map
- You will have three options at the bottom of the Incident Filtering Panel, including Clear and Save.
- You will also have two icons, allows you to export as a PDF or CSV file.
- Select the second button with an icon of a PDF document.
From a Saved Filter:
- Navigate to the Saved tab of the Incident Filter Panel.
- Identify the Saved Filter you’d like to export
- Click on the tick/checkmark icon to the right of the filter name
- Once activated, several options will appear at the bottom of the panel.
- Select the second button with an icon of a PDF document.
Your export will start to download and will typically be available in a few minutes, depending on the size of the dataset. Please note, the maximum number of incidents you can export at any one time as a PDF is 250.
-
How to export data as a CSV
- Using the Export as a CSV tool allows you to manipulate and examine the data a little more closely offline.To start, you’ll need to build a new filter using the Basic or Advanced Filters. You can learn how to do this in the Filtering Incidents section of our Knowledge Base.Alternatively, you can export the data from an existing Saved Filter.
Exporting from new:
- Build out your filter criteria until you’re happy with the dataset shown on the map
- You will have three options at the bottom of the Incident Filtering Panel, including Clear and Save.
- You will also have two icons, allows you to export as a PDF or CSV file.
- Select the second button with an icon of a PDF document.
From a Saved Filter:
- Navigate to the Saved tab of the Incident Filter Panel.
- Identify the Saved Filter you’d like to export
- Click on the tick/checkmark icon to the right of the filter name
- Once activated, several options will appear at the bottom of the panel.
- Select the third button with an icon of a CSV document.
Your export will start to download and will typically be available in a few minutes, depending on the size of the dataset. Please note, the maximum number of incidents you can export at any one time as a CSV is 1,000.
- Using the Export as a CSV tool allows you to manipulate and examine the data a little more closely offline.To start, you’ll need to build a new filter using the Basic or Advanced Filters. You can learn how to do this in the Filtering Incidents section of our Knowledge Base.Alternatively, you can export the data from an existing Saved Filter.
Notifications
INCIDENT NOTIFICATION
-
How to turn notifications off
This article will show you how to easily turn off notifications for new incidents or turn off incident updates from within the platform.
Turn off new incident notifications
- Once you’ve built your Saved Filters, navigate to the Saved tab of the Incident Filter Panel.
- Identify the Saved Filter you’d like to stop receiving alerts for.
- Using the toggle below the name of your filter, you can switch off notifications. The toggle must be greyed out for notifications to be inactive.
To turn the notifications back on, simply use the toggle again to activate the alerts.
-
Turn off incident update notifications
If you’ve used the Watch functionality to receive notifications about incident updates and would like to stop receiving alerts, you can un-watch an incident at any time. You can do this in the same way that you Watched an incident.
-
How to get notifications for new incidents
Make sure that you don’t miss any incidents of interest by setting up alerts using the platform.
Notifications of new incidents are sent via email, to the email address associated with your account. Once notifications are turned on, you will receive alerts of new incidents as soon as they are triggered by the filter criteria you’ve defined.
To set these criteria, you need to create Saved Filters using the Basic or Advanced filters – you can find articles detailing these steps in our Knowledge Base.
- Once you’ve built your Saved Filters, navigate to the Saved tab of the Incident Filter Panel.
- Identify the Saved Filter you’d like to receive alerts for.
- Using the toggle below the name of your filter, you can switch on notifications. The toggle must be highlighted in blue for notifications to be active.
- To turn the notifications off, simply use the toggle again to deactivate the alerts.
-
How to get notifications for incidents updates
We update already reported incidents with new information as and when we receive new intelligence – ensuring you always have the most up-to-date information, and as much context as possible to help you make decisions.
To make sure you’re aware of when an incident is updated or changed, you can use the Watch functionality to ensure you receive a notification when this happens.
You can Watch an incident in several ways:
- From the map interface
- From the Incident List Panel
- From an incident profile
From the map interface
Click on the icon of the incident you would like to follow. This will open an incident balloon, where you will see four icons. Click the first icon, shaped like an eye, to start following incident updates.
The icons should turn green to indicate that you’re Watching that incident. Any updates or changes we make to that incident including, a change in casualty figures, updated summary, change of incident type, or adding an involved party, you’ll receive a follow-up alert to let you know.
From the Incident List Panel
If you have identified an incident that you’d like to follow in the Incident List Panel, you can simply click the first icon – shaped like an eye – to start receiving incident updates.
If you can’t see any icons in the Incident List Panel, you may be looking at the panel in Compact View. Click the Options tab and make sure that the Compact View option is unchecked.
From an incident profile
If you’re currently in an incident profile and would like to follow any updates or changes that we make to that incident, you can click the three dots in the top right-hand corner of the profile – it sits next to the ‘X’ that closes the profile.
Once clicked, an option will appear to Watch that incident.
You can un-watch an incident at any time, by simply clicking on the option again. Once un-watched, you’ll no longer receive alerts about updates or changes.
-
How to get notifications for incidents updates
How to get notifications for incidents updates
We update already reported incidents with new information as and when we receive new intelligence – ensuring you always have the most up-to-date information, and as much context as possible to help you make decisions.
To make sure you’re aware of when an incident is updated or changed, you can use the Watch functionality to ensure you receive a notification when this happens.
You can Watch an incident in several ways:
- From the map interface
- From the Incident List Panel
- From an incident profile
From the map interface
Click on the icon of the incident you would like to follow. This will open an incident balloon, where you will see four icons. Click the first icon, shaped like an eye, to start following incident updates.
The icons should turn green to indicate that you’re Watching that incident. Any updates or changes we make to that incident including, a change in casualty figures, updated summary, change of incident type, or adding an involved party, you’ll receive a follow-up alert to let you know.
From the Incident List Panel
If you have identified an incident that you’d like to follow in the Incident List Panel, you can simply click the first icon – shaped like an eye – to start receiving incident updates.
If you can’t see any icons in the Incident List Panel, you may be looking at the panel in Compact View. Click the Options tab and make sure that the Compact View option is unchecked.
From an incident profile
If you’re currently in an incident profile and would like to follow any updates or changes that we make to that incident, you can click the three dots in the top right-hand corner of the profile – it sits next to the ‘X’ that closes the profile.
Once clicked, an option will appear to Watch that incident.
You can un-watch an incident at any time, by simply clicking on the option again. Once un-watched, you’ll no longer receive alerts about updates or changes.
Static Assets
PLOTTING STATIC ASSETS
-
How to bulk upload your static assets
If you have a large number of assets, we recommend that you use the CSV upload functionality to bulk upload your static assets to the platform.
We provide you with a template CSV file that you’ll need to populate with the correct information. The below steps take you through the bulk upload process in detail.
- In the main navigation panel, navigate to the Organization module.
- Once clicked, a new panel will appear with some further functionality. The icons you see in this panel will depend on the level of functionality you have access to as part of your subscription.
- Find the Static Assets icon and click it.
- A panel will appear and in the top right-hand corner of the panel, will be the option to Upload a CSV. It will be a CSV document icon, second from the left.
- A pop-up will appear providing you with two options: Download CSV or Upload CSV.
- Select Download CSV, and the download of our CSV template will begin.
- Open the template to populate it with the required data. You’ll need:
- Name: This will help you identify the asset, try to be descriptive and clear
- Description: This is a free-type box and an optional field. You can use it to add in any other defining information about that asset, or information that you may find handy to have easy access to in the platform.
- Type: Select the type you’d like to categorize this asset as. These must match what you’ve already uploaded to the platform – read this article for more information.
- Subtype: You can also further categorize an asset using a subtype. As above, these must match what you’ve previously defined on your account.
- Color: You can further differentiate between assets by color-coding them. You may want to consider grouping types by color. For example, all offices are blue. YOu will need to identify the HEX code for the color you’d like to use – this is a good resource to help.
- Telephone: You can add an optional contact number for this asset.
- Latitude and Longitude: We need this information to accurately geolocate your assets.
- Address: You can also add an optional address to this asset.
- Once you’ve completed all of the mandatory fields, you can save the CSV and navigate back to the platform.
- In the Static Assets panel, click the Upload a CSV option again the top right-hand corner.
- When the pop-up appears, this time click Upload CSV.
- Select the saved CSV file from your desktop.
- Click Upload.
- The platform will then start to plot your assets onto the map – this process may take a few moments, depending on how many assets you have.
If there are any errors with your CSV, the platform will highlight exactly which row and column contains the error. If you’re experiencing further issues, reach out to your Customer Success Manager for support.
You can manually add assets to the platform too. We suggest this option if you have a small number of assets, or you’re looking to add new assets to your database following an initial bulk upload.
-
How to manually plot your static assets
How to add static assets you have a small number of static assets or you would like to add a small number of new assets to your existing database, you can manually plot your assets directly on the map
We recommend reading this article about mapping out your Types and Subtypes data before you begin plotting your static assets.
- In the main navigation panel, navigate to the Organization module.
- Once clicked, a new panel will appear with some further functionality. The icons you see in this panel will depend on the level of functionality you have access to as part of your subscription.
- Find the Static Assets icon and click it.
- A panel will appear and in the top right-hand corner of the panel, will be the option to Create a Static Asset. It will be an icon of a building with a plus sign.
- This will open a form for you to complete
- Name: This will help you identify the asset, try to be descriptive and clear
- Description: This is a free-type box, which you can use to add in any other defining information about that asset, or information that you may find handy to have easy access to in the platform.
- Type: Select the type you’d like to categorize this asset as. We recommend uploading these prior to you starting to plot assets. Read this article for more information.
- Subtype: You can also further categorize an asset using a subtype.
- Color: You can further differentiate between assets by color-coding them. You may want to consider grouping types by color. For example, all offices are blue.
- Telephone: You can add an optional contact number for this asset.
- Latitude and Longitude: You can manually add this information or use the icon to the right of these fields to use the map to locate the location of your asset.
- Address: You can also add an optional address to this asset.
- Once you’ve completed all of the mandatory fields, you click Create Static Asset and the platform will accurately geolocate and plot your asset onto the map interface.
If you have a large amount of static assets, we’d recommend using the bulk upload feature to add your static asset data to the platform.
-
How to add static asset types and subtypes
Before you can add your static assets to the platform, you need to define the types and subtypes and upload them to the platform.
Assigning types and subtypes to your assets provides better categorization, and therefore makes filtering and setting up notifications for assets much more granular.
Types are mandatory, however, types are optional. If you need advice or recommendations on what your types and subtypes should be, reach out to your Customer Success Manager, who can help you define these and ensure you’re getting maximum value from this feature.
- In the main navigation panel, navigate to the Organization module.
- Once clicked, a new panel will appear with some further functionality. The icons you see in this panel will depend on the level of functionality you have access to as part of your subscription.
- Find the Static Assets icon and click it.
- A panel will appear and in the top right-hand corner of the panel, will be the option to Create a Static Asset. It will be an icon of a building with a plus sign.
- This will open a form, however, all we want to do at this stage is define your Types and Subtypes.
- Find the fields for Types and Subtypes.
- You will see a plus sign to the right of each field.
- Use the plus sign to add your Types and Subtypes
- Once you’ve added this information, you can close the panel and you’re ready to plot your static assets.
You can manually plot your static assets or you can bulk upload your assets using our CSV template. We have articles in our Knowledge Base explaining each option clearly.
FILTERING STATIC ASSETS
-
How to set up alerts for static assets
The Static Asset Search filter allows you to visualize incidents that have occurred within a specified radius of any assets that you have plotted on the map.
In this section, you will learn how the “Static Asset Searches” filter can be used to do this.
Firstly, however, you will need to create some Static Asset Searches if you have not already. You can read about how to do that here.
Once you have saved your relevant Static Asset Searches, you can filter for them in the Advanced Filter section of the platform. If you’re yet to explore the Advanced Filter functionality, you can check it out here.
- Navigate to the Advanced Filter section of the Incident Filter panel, click Select Filters, and scroll until you find the Static Asset Searched option.
- Click on the Static Asset Searches filter.
- In the first box, you can select any of your saved Static Asset Searches. A drop-down box will appear with your saved options.
- Once you’ve selected your relevant search, you can specify the radius in the box to the right. NOTE: The distance is set to kilometers.
- You can continue to filter your data set by adding additional filters. Click on Select Filters again to start further narrowing down your search.
- As you add filters, the map will start to narrow down the dataset and return results based on your criteria. From here, you can take some additional actions:
- Clear: Clears the current filter
- Save: Save your search results, which you can use to activate notifications. Learn more about saving filters and turning on alerts here.
- PDF: You can export your search as a PDF document, this will only export the last 250 incidents from your search.
- CSV: You can also export as a CSV. This format allows you to download the latest 1,000 incidents.
Remember, the map will show a maximum of 10,000 incidents at any one time. So if your search criteria exceed this limit, you won’t see all of the incidents available within our dataset.
-
How to save static asset searches
Being able to filter using your Static Assets allows you to visualize incidents that have occurred within a specified radius of any assets that you have plotted on the map. Firstly, however, you’ll need to create some Static Asset Searches.
- In the main navigation panel, navigate to the Organization module.
- Once clicked, a new panel will appear with some further functionality. The icons you see in this panel will depend on the level of functionality you have access to as part of your subscription.
- Find the Static Assets icon and click it.
- A panel will appear with two tabs across the top: Filters and Sort
- Select Filters and a dropdown form will appear.
- You can use the options that appear to filter for the assets of interest, similar to how you’d use the Basic and Advanced Filter options to search for incidents.
- Once you’ve creates a set of assets, you can use the options at the bottom of the panel to save your search.
- Select Save.
- Again, similar to how you’d name a saved incident filter, you need to give your Static Asset Search a name too – be descriptive and clear.
- Click Save again to complete.
You can save as many Static Asset Searched as you need. Once saved, they will now appear as available options when using the Static Asset Search filter in the Advanced Filter panel.
-
How to filter for static assets
You can filter by static assets to create alternative views, drill down into relevant incidents and set up notifications.
Before you can filter using your static asset dataset, you will need to create and save Static Asset Searches – you can learn how to do this here.
Once you have saved your relevant Static Asset Searches, you can filter for them in the Advanced Filter section of the platform. If you’re yet to explore the Advanced Filter functionality, you can check it out here.
- Navigate to the Advanced Filter section of the Incident Filter panel, click Select Filters, and scroll until you find the Static Asset Searched option.
- Click on the Static Asset Searches filter.
- In the first box, you can select any of your saved Static Asset Searches. A drop-down box will appear with your saved options.
- Once you’ve selected your relevant search, you can specify the radius in the box to the right. NOTE: The distance is set to kilometers.
- You can continue to filter your data set by adding additional filters. Click on Select Filters again to start further narrowing down your search.
- As you add filters, the map will start to narrow down the dataset and return results based on your criteria. From here, you can take some additional actions:
- Clear: Clears the current filter
- Save: Save your search results, which you can use to activate notifications. Learn more about saving filters and turning on alerts here.
- PDF: You can export your search as a PDF document, this will only export the last 250 incidents from your search.
- CSV: You can also export as a CSV. This format allows you to download the latest 1,000 incidents.
Remember, the map will show a maximum of 10,000 incidents at any one time. So if your search criteria exceed this limit, you won’t see all of the incidents available within our dataset.
News Feed
FILTERING NEWS
-
How to filter for news articles
The News Feed augments our Intelligence Feed with raw, unmoderated news from across the globe.
Depending on your subscription, you may not have access to the News Feed. If you’d like to learn more about accessing this feature, you can speak to your Customer Success Manager.
This article will explain the process of setting up a News Feed filter to narrow your search and find the news articles that are most relevant to your organization.
If you have access to the News Feed, it’ll be the second option on your main navigation bar, down the left-hand side of your screen. The icon will look like a newspaper.
- Click on the News Feed module
- You will then be presented with an empty dashboard, with a button asking you to Add a News Filter – click this.
- A pop-up box will appear, providing you with filtering options.
- Just like an Incident Filter, you can give your News Filter a name. Make it descriptive and relevant to your search criteria.
- Once you’ve given your News Filter a name, you can use the optional filters to start building the appropriate criteria.
- Search: Any search term that you add to this section must be present in the title or summary of the news article.
- Taxonomy: Taxonomies and sub-taxonomies can be used to filter for articles allowing you to reach into our news data in a more effective way
- Country: The news articles only provide country-level location data at this stage.
- Keywords: Unlike the Search filter, the Keywords filter searches the entire article for the word or phrase. They Keywords must be frequently mentioned in the article in order to be returned as a search result.
- Date Range: You can also add a date range to your News Filter.
- Once you’re happy with the criteria that you’ve set, click Save. Or if you’d like to clear your search, press Cancel.
- Once saved, your News Filter will be added to your dashboard. You can currently add three News Filter searches to your personal News dashboard.
-
How to edit your saved news filters
If you’d like to edit or amend your saved News Filters, this article will walk you through the simple steps to making changes to your existing filters.
- Navigate to your News Feed dashboard.
- In the top right corner of each of your saved News Filters, there will be an icon made up of three vertical dots – click on this.
- A drop-down menu will appear providing you with two options: Edit or Remove
- Clicking Edit will trigger the filter menu to appear and you can update and amend your search criteria from here. Click Save when you’re finished editing.
-
How to delete your saved news filters
If you’d like to delete one or more of your saved News Filters, this article will walk you through the simple steps to deleting existing filters.
- Navigate to your News Feed dashboard.
- In the top right corner of each of your saved News Filters, there will be an icon made up of three vertical dots – click on this.
- A drop-down menu will appear providing you with two options: Edit or Remove
- Clicking Remove will delete your News Filter from your dashboard permanently. This action cannot be undone.
Risk Profiles
COUNTRY PROFILES
-
How to use country profiles
How to access, use and get the most value out of the country profiles feature.
Country profiles are one of our premium features; if you have this included as part of your subscription, you will be able to access it by clicking on the profile selector icon in the right-hand side menu. This will open a sub-menu; you can then select country profiles (which is the globe icon).
We have a profile for every country, allowing your team to get a complete overview of country information, including the threat level of a country, linked incidents, involved parties and the latest news. This information is concise and actionable, providing the maximum value for your team. The main benefits of country profiles include:
- Being able to understand the layout of the country, population and other general information such as terrain, climate and natural hazards
- Key actors/individuals that are most active within the country at that time
- The economic and short-term outlook of the country
- Key risks that will need to be considered when travelling to the area
So, how do country profiles work?
- Once country profiles are selected, you will see a list of countries appear
- Select a country by clicking on one from the list
- You will then see an overview of information for that country, and the map will navigate to visually display the incidents in that area
- You can view this information as a full-screen or half-screen; select the option you prefer by clicking on the icons to the right of the country name
- There are various parameters that can be reviewed, including your static assets in that particular country, incidents, involved parties, country information, analysis context, overall threat level and your custom information
- You can then drill down further to gain more information about specific areas of interest within that country
- You can also access the news feed through this view; this is a list of real-time news articles associated with the country
-
How to use actor profiles
How to find, use and get the most value out of the actor profiles feature.
Actor profiles are one of our premium features; if you have this included as part of your subscription, you will be able to access it by clicking on the profile selector icon in the right-hand side menu. This will open a sub-menu; you can then select actors (which is at the top of the sub-menu).
We have hundreds of actor profiles for various groups and individuals operating within different countries. This information is concise and actionable, providing the maximum value for your team. The main benefits of actor profiles include:
- Being able to gain a quick understanding of who the actor is and what they stand for
- Other linked/involved parties the actor may have collaborated with
- Key incidents associated with the actor
So, how do actor profiles work?
- Once actor profiles are selected, you will see a list of actors appear
- Select an actor by clicking on one from the list or using the search functionality under ‘filters’ at the top of the actor list to find a specific person or group
- You will then see an overview of information for the actor you have selected
- You can view this information as a full-screen or half-screen; select the option you prefer by clicking on the icons to the right of the actor’s name
- There are various parameters that can be reviewed, including an up-to-date list of incidents (which can be filtered by type and date using the filter functionality within the incident list tab), involved parties and a real-time news feed containing news articles associated with the actor
- You can then drill down further to gain more information about specific areas of interest within the profile by clicking on another actor or a specific incident, for example
-
Using the threat grid
The Threat Grid is a simple way to visualize country threat assessments at a high level. This fully customizable feature is built around your business needs. This article will explain how the Threat Grid works.
This feature is linked to the Threat Map; if you haven’t already read about it, you can do so here.
The Threat Grid is an alternative view of the map that allows you and your team to see, at a glance, what the level of threat is within different categories corresponding to different countries.
If you have already set threat levels for countries most relevant to your business in the Threat Map, you can view and amend them here. If not, refer to the Threat Map article to set these up.
This is a fully customizable feature that will be built to meet your organization’s bespoke needs.
Below is an example of what could be created for you and an explanation of how it would work if you requested this feature.
- To access the Threat Grid, click on the organization tab and select ‘Threat Grid’, which is situated just below ‘Threat Map.’
- To edit a country’s threat level, you can click on the company name and navigate to the country profile to amend it.
- You will then see the ‘threat level’ module on the right-hand side.
- To edit the level of threat within each category, click ‘edit’ in the bottom right-hand corner of this section.
- Each category can then be rated from very low to severe by dragging the slider to the right.
- The ‘overall’ category is not automatically populated; you can also set this yourself to reflect how these threats impact your organization universally.
- When you have finished editing, click on the ‘tick’ icon in the bottom right-hand corner.
- Once the country has been given a new threat rating, it will be highlighted in a color.
- For example – The colors used could be green, yellow, amber and red to reflect low to severe threat levels.
- Grey means that the country hasn’t been set yet.
Once set up, you can view a threat assessment of countries that matter most to you.
- Navigate back to the main dashboard and click on the Threat Grid icon within ‘Organization’ in the right-hand side menu.
- The country name and categories are at the top of the page, which allows you to view a threat assessment of each country without having to go into the country profile.
- You can search for a country by using the search bar at the top of the page.
- Otherwise, all countries you have set threat levels for will appear in a list format, and each will have a corresponding rating for each category.
- The ‘overall’ threat level will match the color that it is on the map; for example, this could be set up to reflect green as low risk and red as severe risk.
-
Using the threat map
The Threat Map feature provides you and your team with a high-level visual overview of the level of threat within specific countries. This article will show you how the feature works.
The Threat Map is a fully customizable feature. It allows you to score countries based on criteria that matter to you and your team. It then provides a very high-level overview of the threat level, aiding with decision-making by reflecting exactly how you measure threat.
Below is an example of what could be created for you and an explanation of how it would work if you requested this feature.
- The Threat Map can be accessed by navigating to the organisation icon on the right-hand side menu and clicking it to see the sub-menu appear.
- Click the ‘Threat Map’ icon within this menu.
- The map will then appear on the screen; the example uses some fictitious categories for demonstration purposes.
- Clicking each of these categories will provide an overview of the threat level within each corresponding country.
- You can edit each country individually by right-clicking on it and using the ‘country profile’ icon that appears in the box next to the country name.
- Note: You can also edit a country by navigating to a country profile and editing the threat level module on the right-hand side. If you are new to country profiles, learn more here.
- When you are within the country profile, you will see the section that states ‘overall threat level’.
- If it currently does not have a threat level set, it will state ‘not set’, and each of the category sliders will be blank.
- To populate a level of threat within each category, click ‘edit’ in the bottom right-hand corner of this section.
- Each category can then be rated from very low to severe by dragging the slider to the right.
- The ‘overall’ category is not automatically populated; you can also set this yourself to reflect how these threats impact your organisation universally.
- When you have finished editing, click on the ‘tick’ icon in the bottom right-hand corner.
- Once the country has been given a threat rating, it will be highlighted in a colour.
- For example – The colours used could be green, yellow, amber and red to reflect low to severe threat levels.
- Grey means that the country hasn’t been set yet.
YOUR ACCOUNT
-
How to log in to the platform
Learn how to log in to the Intelligence Fusion platform.
- To log in to the Intelligence Fusion platform, go to app.sigma7.com.
- If you’re new to the platform and this is your first time logging in, you’ll need to open the email that was sent to you when your account was created.
- Use the login details included in that email to access your account.
- Once you’re on the login page, you’ll need the email address associated with the account and to enter your password.
- Click the login button.
- Once you’re successfully logged in to the platform, we recommend that you update your password to something more secure in your account settings.
- Two-factor authentication (2FA) is now mandatory on all Intelligence Fusion accounts. If you’re logging in for the first time, you’ll be prompted to set this up.
-
How to log out of the platform
Learn how to log out of the Intelligence Fusion platform.
- To log out of the platform, click on the icon made up of three dots in the top right-hand corner of the platform.
- drop down box will appear providing you with several options.
- Simply click Logout.
- You will then be taken back to the platform login page.
-
How to update your password
If you’ve forgotten your password or would like to routinely change it to ensure your account is secure, you can follow these steps.
Forgotten Password
If you can’t log in to the Intelligence Fusion platform because you’ve forgotten your password, you’ll need to follow the Forgotten Password flow.
- Head to the login page.
- Click Forgotten Password.
- Enter the email address associated with your Intelligence Fusion account.
- Click Reset My Password.
- Wait for the email to arrive in your inbox and click the link to set a new password.
- Navigate back to the login page and use your new details to access your account.
Update Password from Account
If you’re already logged in to the Intelligence Fusion password but would like to change your password manually, you can do this in your Account Settings.
- Navigate to your Account Settings by clicking on the icon made up of three vertical dots in the top right-hand corner of the platform.
- A dropdown list of options will appear.
- Select Settings.
- You will be taken to your Account Settings page.
- Here, you can change your password.
- Make any necessary changes and click Update.
- Log out of the platform and back in using your new details.
-
How to turn on two-factor authentication (2FA)
How to keep your data safe by activating 2FA on your Intelligence Fusion account.
Two-factor authentication (2FA) is now mandatory on all Intelligence Fusion accounts. 2FA won’t be new to you; it’s a mandatory requirement for most software and platforms you use daily. It’s designed to significantly reduce the risk of unauthorized access and system breaches by adding a second layer of identification when logging into the platform.
We know that many of you use us whilst on the move, too, so enforcing 2FA means you’ll have greater security when accessing Intelligence Fusion from any device or location – without putting your sensitive data at risk.
- You’ll be prompted to enable 2FA when you log into your Intelligence Fusion account for the first time. The process is simple to follow on screen, and the platform will walk you through each step.
- You’ll need to download the Google Authenticator or similar app on your mobile phone. Or click, I want to use email instead.
- Once you’ve enabled 2FA, you will not need to do anything again, but you will need the authentication code each time you log in to the platform, accessing it either via the authenticator app or via your email.
-
How to update your account details
If you need to update some of the details on your account, you can do so via the Intelligence Fusion platform – here’s how.
- Navigate to your Account Settings by clicking on the icon made up of three vertical dots in the top right-hand corner of the platform.
- A dropdown list of options will appear.
- Select Settings.
- You will be taken to your Account Settings page.
- Here, you can change your first name, last name, display name and password.
- Make any necessary changes and click Update.
If you would like to change your email address, this would need to be done by contacting your Customer Success Manager.
General FAQ
General Questions
-
How can I update my Intelligence Collection Plan?
Keeping us up to date on your intelligence requirements continues to ensure that you’re getting the most relevant and tailored feed possible.
Your Intelligence Collection Plan (ICP) is a dynamic and fluid document. We’ll regularly review it together, but you can also change and update the details at any time.
We recommend doing this with your Customer Success Manager, who can contact using the following details:
📨 rebeccasutton@intelligencefusion.co.uk
☎️ +44 (0)1931 770 110
Whilst we strive to be as flexible and accessible as possible, your Customer Success Manager will typically work UK office hours, between 9.00am and 5.00pm GMT.
If you have an urgent intelligence request outside of these hours and aren’t receiving a response from your CSM, you can contact our 24/7 Operations Team on the following details:
📨 operations@intelligencefusion.co.uk
☎️ +44 (0)191 380 4004
-
How can I get further support?
Your Customer Success Manager is here to ensure you get the most out of your subscription, and is your first point of contact should you need any further support.
You can contact your Customer Success Manager using the following details:
📨 rebeccasutton@intelligencefusion.co.uk
☎️ +44 (0)1931 770 110
Whilst we strive to be as flexible and accessible as possible, your Customer Success Manager will typically work UK office hours, between 9.00am and 5.00pm GMT.
If you need urgent support outside of these hours and aren’t receiving a response from your CSM, you can contact our 24/7 Operations Team on the following details:
📨 operations@intelligencefusion.co.uk
☎️ +44 (0)191 380 4004
-
What is an Intelligence Collection Plan, and why do I need one?
Compiling an ICP is an essential part of the onboarding and delivery process, in this article, we will take a look at why.
An Intelligence Collection Plan (ICP) helps to close gaps in knowledge and provides clear direction for the intelligence collection process. An ICP also gives intelligence teams a standard structure to work from and helps analysts stay focused on the task at hand.
The intelligence collection plan process helps us to develop a deep understanding of your operations as well as who or what you’re protecting.
We aim to understand:
- If there are any gaps in your current intelligence collection
- The geographical areas you operate in and any plans for future expansion
- Any properties or assets across the globe you’ll be monitoring
- Where your people and employees regularly travel
- If there are particular routes they take, accommodation that they stay in or places they visit
- Groups of interest, including activists, terrorists and extremists
- Historical threats to your business or the industry as a whole
Whilst our coverage is global, we prioritize our client’s needs first and foremost. The detail we collect allows us to provide you with a comprehensive and complete intelligence picture tailored to your organization.
One of the first milestones of your onboarding journey includes an ICP, which is then regularly reviewed on a monthly basis. This critical session will guide our collection efforts and ensure that our team fully understand how your organization operates, the threats you face and why they’re important.
Your intelligence collection plan is a working document. So as your organization evolves or your needs change, we can be reactive to new requirements.
For example, if you’ve recently acquired a new asset or facility in a new region, or your business operations have changed to adapt to the ‘new normal’, you may need us to start collecting intelligence in new areas that weren’t part of your original collection plan.
These requests may be temporary or long-term – either way, we’re structured in a way that allows us to quickly and easily react to changing requirements.
-
How do the intelligence analysts work?
Gathering intelligence is a thorough and skilled process; in this article, we explore how intelligence analysts work.
The Intelligence Fusion Operations Team is made up of 20 highly trained intelligence analysts with a diverse range of experience and expertise. The team work around the clock from our 24/7 Operations Centre to identify, report and analyze incident data for our clients.
Doing so, starts with our military principles – using the intelligence cycle to put order into the intelligence collection process and drive our analysis.
Due to the vast amount of data available, the intelligence cycle provides an order to the collection and information-gathering process. It states exactly what needs to be collected, in what priority and when. We use the intelligence cycle internally for various reasons. But most importantly, it helps us focus our collection efforts to best meet the needs of you and your organization.
This is a four-stage process comprising Direction, Collection, Processing and Dissemination.
Step 1: Direction
The first stage of the cycle is to determine the intelligence requirements and plan the collection efforts – creating a clear focus and list of priorities for the intelligence team and ensuring that all information gathered is geared towards a clear purpose.
Step 2: Collection
Once we have the intelligence requirements, we can begin our collection process – using our vast range of sources with both manual collection from our 24/7 operations center and automated collection through datamining.
Step 3: Processing
We use the intelligence cycle internally for several reasons, but most importantly, it helps us focus our collection efforts to best meet the needs of you and your organization. The result of this is that, regardless of if the incident was identified by our team or picked up by our datamining technology, each new piece of information is:
- Accurately geo-located
- Graded based on the reliability and credibility of the source
- Reviewed and verified to eliminate false information
- Analyzed to determine patterns, trends of connections
- Structured in a way that’s easy to interpret and act upon
This ensures accurate data is reported that’s not only insightful but practical, too.
Step 4: Dissemination
The final stage of the intelligence cycle is the timely delivery of intelligence to those who need it through threat intelligence software.
Intelligence must be disseminated in a way that’s appropriate for the user, highlighting the key facts and our interpretation, comment or assessment. This is why we emphasize the way incident data looks within our threat intelligence platform.
The Intelligence Cycle is part of wider training that all our intelligence analysts partake in as part of their onboarding and ongoing development. The training was designed using military intelligence processes and principles alongside all real-life experiences, case studies and examples from our intelligence teams’ previous careers spanning multiple countries and sectors.
Alongside the specialist training that all our analysts have, many are also subject specialists and bilingual, which allows for a wider range of sources to be accessed. Languages that are spoken within the team include but are not limited to Russian, French, Spanish, Arabic and Hindi.
Our analysts come from a variety of backgrounds, including academic, military and commercial. They cover broad geographical regions, but specialty areas and specific interests include security in South and Central Asia, politics in China and the Taiwan Strait, Iraqi domestic politics and anti-AI sentiment in the USA.
Our analyst team combines military experience with academic backgrounds, with many of our team holding post-graduate degrees in relevant themes such as terrorism studies and military history.
©2026 Sigma7 :: All Rights Reserved :: Site by 2NDST