


Executive Summary
As Wilfran Moufouma Okia, Chief of Climate Prediction at the World Meteorological Organization, explains in an agency briefing, “After a period of neutral conditions at the start of the year, climate models are now strongly aligned, and there is high confidence in the onset of El Niño, followed by further intensification in the months that follow.”
A companion advisory from the U.S. National Oceanic and Atmospheric Administration’s Climate Prediction Center states that “El Niño is likely to emerge soon”—an 82 percent chance between May and July—and is expected to “continue through Northern Hemisphere winter 2026-27 (96 percent chance).”
Aon’s latest catastrophe review indicates that natural hazards caused 368 billion USD in economic losses during 2024, about 60 percent of which went uninsured. Organizations with outdated business-interruption values or limited continuity planning risk joining that uninsured majority if 2026 follows historic El Niño impact patterns.
A Climate Pattern with Global Reach: What Makes the 2026 El Niño Unique?
El Niño refers to a temporary warming of central and eastern equatorial Pacific waters that disrupts global weather. The World Meteorological Organization notes that the phenomenon typically lasts nine to twelve months, recurs every two to seven years and triggers marked shifts in rainfall, drought and storm tracks across continents. These shifts reverberate through supply chains, energy systems and commodity markets.
Probability, Timing and Forecast Uncertainty
The CPC ensemble assigns formation odds above 80 percent by mid-2026, yet forecasters acknowledge a “spring predictability barrier” when ocean-atmosphere coupling is still stabilizing. A European weather and climate research center reports that forecast confidence usually rises after May once weakening trade winds confirm sustained feedback. Acting on probabilistic thresholds rather than waiting for certainty allows companies to position inventory, labor and finance ahead of tightening lead times.
Event Strength and Local Impact
A synthesis in Nature paraphrases multiple model runs and finds that while NOAA places only a 37 percent chance on a top-tier warming outcome, European models allow for anomalies near 3 °C above average by November. CPC analysts remind risk managers that “stronger El Niño events do not ensure strong impacts,” because regional outcomes still hinge on local sea-surface temperatures, mid-latitude circulation and soil-moisture baselines.
Climate Change as an Amplifier
“There is no evidence that climate change increases the frequency or intensity of El Niño events,” the WMO states, “but it can amplify associated impacts because a warmer ocean and atmosphere increases the availability of energy and moisture for extreme weather events such as heatwaves and heavy rainfall.”
The UK Met Office adds that an El Niño today “will impart heat into the atmosphere and, generally, raise global average temperatures by around a fifth of a degree Celsius,” pushing heat records higher and intensifying stress on infrastructure and public health.
Taken together, these insights point to a likely El Niño whose ultimate footprint will depend on strength and regional climate context but whose probability is already high enough to justify targeted action.
Geographic and Sectoral Impacts: How El Niño 2026 Will Disrupt Business Operations
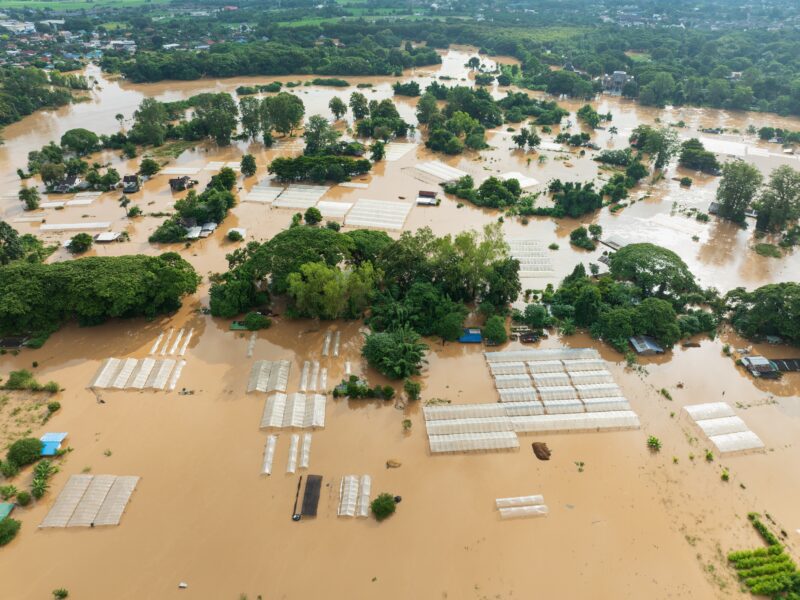
Historical composites show that El Niño rearranges global precipitation and temperature in repeatable yet region-specific ways. Wetter conditions often emerge in the southern United States, southern South America and the Horn of Africa, while drought tends to dominate Australia, Indonesia and much of South and Southeast Asia. Businesses across agriculture, energy, manufacturing and logistics face distinct exposure pathways that warrant deeper analysis.
Agriculture and Food Systems
In South America, excessive rainfall can delay soybean harvests, saturate storage silos and promote fungal outbreaks, trimming export volumes when global demand is high. At the same time, suppressed monsoons in India may cut rice output and prompt export restrictions, tightening global grain supply. Producers can counter these risks by diversifying geographic sourcing, investing in drought-tolerant crop varieties and using seasonal-climate analytics to time planting.
Energy Generation and Networks
Hydropower reservoirs from Zambia’s Kariba Dam to Chile’s Andean catchments have historically recorded inflow deficits during El Niño episodes, forcing utilities to substitute thermal generation just as heatwaves raise cooling demand. Gas and coal procurement models should therefore evaluate both supply scarcity and demand spikes. In the United States, increased winter precipitation often lowers natural-gas demand, affecting forward contracts and storage strategies.
Mining, Manufacturing and Logistics
Water-intensive extraction of copper, lithium and bauxite can be curtailed when drought reduces river flow or raises cooling-water temperatures. Manufacturers dependent on just-in-time inputs risk production halts if parts suppliers in flood-prone corridors are cut off. Mapping supplier tiers against ENSO teleconnections helps isolate vulnerabilities. For logistics, heavy rainfall elevates the prospect of port closures in Peru and landslides along U.S. rail corridors, requiring contingency routing and adjusted delivery windows.
Workforce Health and Productivity
Heatwaves intensified by El Niño can push wet-bulb temperatures beyond safe thresholds, particularly in construction and agriculture. Employers should integrate heat indices into shift scheduling, provide shaded rest areas and adjust performance metrics to reflect productivity impacts.
Geopolitical Stability and Community Relations
Water scarcity and food-price inflation have historically fueled protests and migration, notably in drought-sensitive regions of Sub-Saharan Africa and South Asia. Corporations with local operations should monitor commodity prices, election cycles and water-allocation disputes, aligning security protocols with rising social tension potential.
Collectively, these sector analyses underscore the need for multidimensional monitoring: meteorological metrics, supply-chain dependencies and socio-political indicators combine to define the full spectrum of El Niño exposure.
Business Interruption Values: Why Updating Is Critical in the Era of Climate-Driven Nat Cats
Business-interruption (BI) insurance bridges income gaps when physical damage or supplier outages halt operations, yet coverage fails when declared values understate real-world revenue or extra expense. Aon estimates that in 2024 natural catastrophes left more than half of global economic losses uninsured, revealing substantial insurance-to-value gaps.
Inflation, Digital Revenue and Worksheet Obsolescence
Many BI worksheets date back decades and overlook modern cost drivers such as expedited freight premiums, data-center redundancy charges and contractual penalties for service-level breaches. The Zurich Insurance commentary by Steve Penwright warns that outdated worksheets “led to under-reported BI values,” particularly during periods of high inflation. Adjusting for current wage rates, raw-material costs and digital-platform revenues is essential to restoring accuracy.
Contingent and Service-Interruption Exposure
Supply chains now stretch across multiple climate zones. If a sole-source component manufacturer in Indonesia faces drought-related power rationing, the downstream revenue loss may exceed on-premises earnings. Contingent BI values should therefore reflect sales at risk from tier-one and tier-two suppliers, utility outages and even third-party cloud downtime.
Modern Valuation Methodology
A robust valuation exercise separates variable from fixed costs, models seasonal demand swings and quantifies contractual penalties. Probable maximum loss (PML) and maximum foreseeable loss (MFL) scenarios help set sub-limits for extra expense and ingress/egress. Annual external reviews add credibility at renewal, strengthening negotiations for favorable waiting periods and deductibles.
Claims Efficiency
Accurate, well-documented BI schedules accelerate claims. Forensic analysts can validate “but-for” revenue faster, reducing adjuster queries and freeing interim payments. Accurate valuations also help executives gauge the self-funded buffer needed should an event exceed insured limits.
By pairing modern valuation techniques with rigorous documentation, organizations close the insurance-to-value gap, gaining clarity on residual risk.
Risk Engineering and Resilience Planning: Building an Adaptive Strategy for El Niño and Beyond
Engineering resilience converts forecast information into asset-level action. The approach below synthesizes guidance from international risk-engineering forums and continuity institutes.
Facility Assessments and Digital Twins
Engineers deploy laser scans and drone imagery to build three-dimensional models of buildings and infrastructure. These digital twins simulate wind, flood and heat stresses, allowing cost-benefit ranking of retrofits such as reinforcing roof decks, elevating electrical switchgear or installing flood barriers. Data feeds into insured-loss models, assisting in premium negotiations.
Hazard-Intelligence Integration
Meteorological APIs deliver agency forecast values and ensemble outputs to enterprise dashboards. When projected rainfall intensity for a watershed surpasses thresholds tied to prior flood-depth studies, automated alerts trigger pre-staging of pumps and relocation of high-value inventory. Linking hazard data to trigger-based budgets helps avoid ad-hoc spending spikes.
Business-Continuity Plan Maturity
Modern BCPs merge finance, HR, IT and operations under aligned escalation levels. An upgrade from ENSO Watch to Advisory, for example, can initiate remote-work tests, supplier status checks and fuel-supply validation. Clear responsibility matrices prevent delay, ensuring critical decisions occur within defined timeframes.
Scenario-Based Exercises
Quarterly drills reveal untested assumptions, such as an alternative data-center region that faces the same climate hazard or generator contracts that lack guaranteed fuel deliveries. Post-exercise action items feed directly into capital plans and policy renewals.
Measuring Impact
Metrics such as downtime avoided, claims severity reduced and premium credits achieved help demonstrate return on resilience investment. Continuous measurement fosters iterative improvement.
By integrating engineered safeguards, live data and trained personnel, companies can transition from reactive fixes to proactive risk management that cushions both financial and reputational impact.
Nat Cat Claims: What to Expect and How to Optimize Recovery
The natural-catastrophe claims landscape is characterized by higher loss totals and stricter underwriting. Insured losses have topped 100 billion USD every year since 2020, reflecting not only tropical cyclones but also inland floods and severe convective storms.
Policy-Structure Vulnerabilities
Long waiting periods, low sub-limits and exclusions for secondary perils can erode coverage. For example, flood often follows heavy El Niño rainfall, yet many all-risk policies carry restrictive flood endorsements. Adjusting these terms before renewal ensures that capital reserved for recovery is truly available.
Documentation Discipline
A claims-management white paper emphasizes that “prompt notice and organized records are essential” for interim payments. Companies with pre-assigned cost codes, geo-tagged photo protocols and cloud-based expense logs reduce adjuster turnaround times. Direct quotes from adjusters confirm that coherent submissions “cut review cycles by several weeks,” improving liquidity during rebuilding.
Negotiation Leverage
Insurers routinely appoint forensic accountants and engineers to vet large claims. Organizations that present reconciled revenue models and engineering reports demonstrating pre-loss conditions frequently secure faster settlements and avoid protracted debate over causation or quantum.
Pre-Loss Priorities and Claims Readiness
- Align exclusions, deductibles and waiting periods with operational realities.
- Refresh BI and extra-expense values annually, incorporating inflation and digital revenue.
- Evaluate contingent exposures to suppliers, utilities and cloud platforms.
- Assign clear claim roles and conduct documentation rehearsals.
- Pre-contract vendors for debris removal, emergency power and temporary workspace to support extra-expense claims.
Strengthening the Financial Lifeline
A well-structured claims-readiness program ensures that funds arrive when repairs, payroll and customer obligations peak. In an era when adjuster resources may be stretched across multiple concurrent disasters, preparedness can spell the difference between a short interruption and a protracted recovery.
Leading with Resilience: Strategic Takeaways for Business Leaders
El Niño 2026 underscores a broader lesson: volatile climate-driven events compress decision windows and elevate stakes across supply chains, capital markets and communities. Five strategic imperatives rise to the fore:
Trigger-Based Action Planning
Relying on probabilistic thresholds, not calendar milestones, enables dynamic adjustment of staffing, inventory and capital expenditure.
Regional Granularity
Global forecast products must be downscaled to basin or watershed level. Local soil-moisture deficits or saturated catchments can flip a neutral anomaly into a decisive flood or drought risk.
Financial-Physical Integration
Updated BI schedules inform engineering priorities, while retrofit work can unlock premium credits or deductible reductions, reinforcing the investment case.
Human-Centered Preparedness
Well-being policies for heat-exposed staff, clear communication channels and mental-health resources protect productivity and retention, reducing indirect costs of disruption.
Learning Loops and Governance
Post-event reviews, board-level dashboards and continuous-improvement budgets ensure that each hazard cycle produces actionable lessons rather than one-off reports. A culture of transparency around near-misses builds organizational muscle memory.
By adopting these practices, companies move beyond compliance toward a resilience culture that preserves shareholder value and community trust.
For further information or support on risk management and resilience planning, contact Sigma7.
Sources:
World Meteorological Organization: https://wmo.int/media/news/wmo-likelihood-increases-of-el-nino
NOAA Climate Prediction Center: https://www.cpc.ncep.noaa.gov/products/analysis_monitoring/enso_advisory/ensodisc.shtml
Nature: https://www.nature.com/articles/d41586-026-01538-0
UK Met Office: https://www.metoffice.gov.uk/blog/2026/met-office-what-is-el-nino-and-will-we-see-one-this-year
European weather and climate research center blog: https://www.ecmwf.int/en/about/media-centre/science-blog/2026/el-nino-2026


