


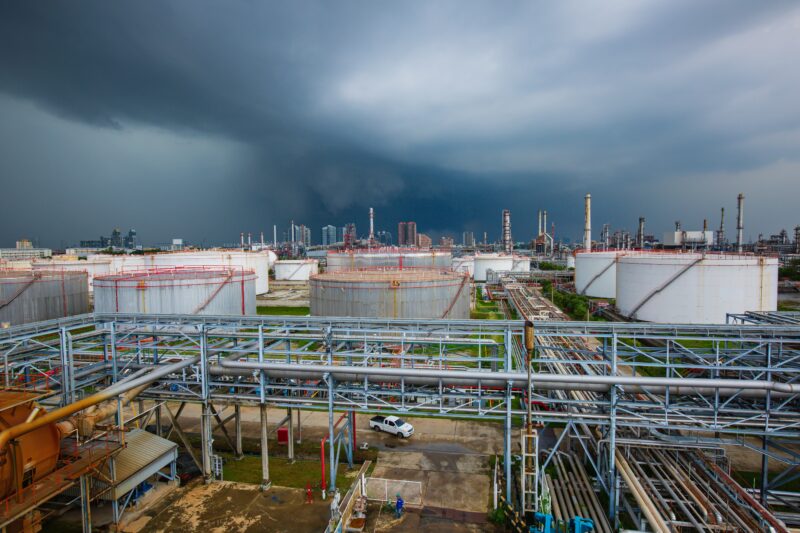
In a market already grappling with tighter insurance terms and rising deductibles, the financial weight of physical climate risk is unmistakable. As Munich Re reports, “natural hazards caused a total global loss of around US$ 224 billion” in 2025, and 42 separate events each inflicted at least one billion dollars of damage.
Yet many corporate risk frameworks still concentrate on a narrow subset of perils, most often river flood or hurricane wind. Other fast-growing threats remain largely unquantified. That gap becomes critical when cascading hazards disrupt utilities, obstruct access routes or shut down suppliers long before floodwaters reach the factory gate.
According to UNEP FI, the industrial sector spanning steel, cement, petrochemicals and other energy-intensive industries is responsible for about a quarter of global CO₂ emissions. The same facilities that drive energy demand are increasingly exposed to the physical consequences of a warming climate.
Why Broader Climate Risk Assessment Matters
Industrial operators cannot afford that blind spot. Even the best insurance programs depend on accurate time-element assumptions. As Dean & Draper Insurance Agency notes, “The restoration period in your BI policy … will set the length of time that you will be compensated for lost income and extra expenses.”
Many business interruption policies include waiting periods, commonly ranging from 48 to 72 hours, although terms vary by insurer and policy language. As a result, extended downtime can create significant uninsured costs depending on the coverage structure.
Here at Sigma7, we evaluate 12 natural hazards in every Climate Change Impact Report. For each hazard, we explain how return periods and climate indicators inform our ratings, what Increased and Severely Increased designations mean in operational terms and how those ratings translate into estimated business interruption duration.
While exposure profiles differ across North America, Europe and APAC, the assessment logic remains globally consistent. It is designed to support organizations navigating evolving climate disclosure frameworks and regulatory developments. The discussion begins with flooding, still the costliest peril worldwide. It then moves through wind, convective, fire-weather, cold-stress and chronic-heat hazards to provide a complete view of the risks shaping industrial resilience today.
Evaluating Flood Pathways Across River and Coast
Flood is often the first peril executives model, yet its drivers differ radically by geography. Overflowing rivers follow watershed hydraulics, while coastal surge couples with wind fields, tides and sea-level rise. Each pathway creates distinct damage patterns, access challenges and recovery timelines, so separating them is essential when you translate hazard scores into capital planning, insurance strategy and continuity engineering.
A broader evaluation also forces you to look beyond headline flood maps. Climate change is shifting rainfall intensity, storm tracks and drainage capacity, which means access roads, third-party utilities and supplier hubs may go offline even if the primary facility sits above historical flood levels.
1. River Flood
River flooding occurs when channels and floodplains can’t contain upstream runoff. Facilities built on historical floodplains, or near levees designed for past climates, face rising uncertainty as land-use change accelerates drainage and heavier downpours push rivers above design capacity.
Measurement relies on peak water level, inundation depth, flow velocity and recession time, each tied to a statistical return period. According to the Intergovernmental Panel on Climate Change, “Heavy precipitation will generally become more frequent and more intense” with additional warming, and it further indicates that the frequency of 10- and 50-year storms could double or even triple at four degrees of warming. In practical terms, a flood modeled as 1-in-100 today may resemble 1-in-30 within a single asset life cycle.
An Increased rating typically signals shallow yard flooding, intermittent utility outages and downtime measured in days. A Severely Increased rating may be associated with structural water ingress, prolonged debris removal and contaminated soils. Production disruptions can persist for extended periods, especially when access roads or rail infrastructure remain submerged.
2. Coastal Flood and Cyclone
Coastal facilities contend with compound events merging storm surge, extreme rainfall, hurricane-force wind and rising mean sea level. IPCC research shows the probability of compound flooding involving surge, heavy precipitation and elevated river flow has already risen and will keep climbing with additional warming.
Hazard scoring integrates separate return periods for surge height, peak wind speed and 24-hour rainfall, then layers on sea-level projections and inland storm persistence. A tropical cyclone that retains strength 300 kilometers inland can propagate coastal risk far beyond the shoreline, overwhelming drainage, shutting ports and delaying receipt of critical feedstocks.
Operational consequences extend well outside the fence line.
Under an Increased rating, organizations may face short-term port closures, contaminated stockpiles and limited roof damage. Recovery is often measured in days or weeks. A Severely Increased rating points to a greater risk of prolonged downtime. Damaged loading berths, workforce displacement, grid instability and restricted transport links can delay recovery long after the storm has passed.
From large-scale inundation mechanisms we now turn to hazards created when water accumulates on site or when broad wind fields test the integrity of roofs, cladding and utilities.
Evaluating Surface Water and Broad Wind Exposure
Flood maps often miss hazards that emerge when an intense thunder-cell parks over a facility or when a mid-latitude cyclone drives hours of gale-force gusts across inland corridors. Local drainage limits, shallow groundwater tables and aging roof systems can turn an apparently “low-risk” location into a source of extended downtime.
A comprehensive review therefore looks at site-level drainage, groundwater behavior and structural wind resistance alongside regional hazard data. It also tests how concurrent failures – blocked culverts plus power-line damage, for instance – could interact to prolong interruption beyond the physical repairs themselves.
3. Rain Flooding and Groundwater
Yard grading, trench networks and sump pumps are designed for a finite load. When short cloudbursts exceed those assumptions, water can back up around loading docks, seep into basements and saturate soils supporting critical foundations. Prolonged wet seasons compound the problem by keeping groundwater levels elevated. Even moderate rainfall can then force water through floor joints and service conduits.
Measurement focuses on rainfall-intensity thresholds linked to return periods as short as one, five or ten years. It also considers site factors such as inlet spacing, pipe capacity and soil permeability. An intergovernmental climate assessment notes that extremes can be measured by either frequency or magnitude. Because warming influences both, historical percentiles are becoming a less reliable basis for design.
An Increased rating usually brings nuisance flooding – isolated equipment shutdowns, minor contamination and a few days of cleanup. A Severely Increased rating signals the probability of sub-floor water, compromised switchgear, mold-driven product losses and multi-week drying before safe restart.
4. Windstorm
Severe synoptic windstorms aren’t confined to coastlines. Intensifying jet-stream waviness and shifting storm tracks expose inland industrial belts to longer durations of damaging gusts. Roof membranes, wall cladding, stack linings, conveyor covers and external pipe racks bear the brunt, while airborne debris can breach glazing or puncture tanks.
According to Munich Re, “1-in-100 Year Hazard Intensities provide quantifiable measures of the intensity of events with a return period of 100 years, such as flood inundation depths and peak wind speeds.” Those benchmarks help facilities translate climate signals into damage-degree estimates that drive insurance limits and engineering retrofits.
Construction quality and maintenance history are critical modifiers; two plants in the same wind zone can show very different failure modes if one relies on aging fiberglass panels and the other on retrofitted standing-seam metal.
Under an Increased rating, operators might plan for targeted panel repairs, limited product loss and brief utility disruptions. A Severely Increased rating anticipates widespread roof uplift, collapsed canopies, toppled cooling towers and power outages that stretch downtime from days into weeks.
With wind and surface-water vulnerabilities defined, attention shifts to rapid-onset convective and electrical hazards that strike faster than any forecast cycle yet can halt production just as effectively.
Evaluating Fast-Onset Convective and Electrical Threats
Sudden-onset hazards such as severe thunderstorms can halt production within seconds by knocking out power, igniting fires or destroying control systems. Because these events develop and dissipate quickly, their effects often outstrip the assumptions in traditional emergency plans. Facility managers therefore need clear insight into strike densities, equipment sensitivity and repair lead times to understand how a short weather burst can trigger outsized loss.
5. Lightning
Direct strikes and nearby flashes can trigger everything from minor nuisance trips to catastrophic fires. High-value automation, distributed control systems and power electronics are especially vulnerable to surge damage, while metal roofs, storage tanks and stack structures attract strikes that can puncture shells or ignite flammable vapors.
Risk evaluation begins with regional strike-density maps, seasonal occurrence windows and the presence – or absence – of engineered lightning-protection systems. Asset sensitivity guides refinement: a petrochemical distillation column calls for a different shielding and bonding regime than an inert-goods warehouse. Projected shifts toward more energetic convective storms in several mid-latitude regions increase uncertainty around future strike frequency.
An Increased lightning rating often equates to brief outages as breakers trip and reset, plus spot repairs to instrumentation. A Severely Increased rating anticipates failed drives, damaged transformers, potential roof fires and procurement delays for custom components – downtime that can stretch from days into weeks.
6. Tornado
Tornadoes concentrate extreme winds into corridors sometimes no wider than a single production line yet powerful enough to tear steel panels from buildings, collapse piping racks and scatter roof ballast across process areas. Unlike broader windstorms, their highly localized nature means a facility can sustain near-total destruction while neighboring sites remain largely untouched.
Exposure analysis begins with regional climatology. Touchdown density, path length and seasonality establish baseline probabilities, often expressed as return periods of one in 250 or one in 500 years. Although research remains inconclusive on future tornado frequency, warmer and more humid atmospheres provide additional energy for severe convective outbreaks. As a result, uncertainty ranges may widen over time. Site resilience therefore hinges on the robustness of primary structures, safe-room availability and debris-impact resistance.
Under an Increased rating, modeling suggests limited roof and cladding damage, scattered missile impacts and a recovery period of several weeks. Material lead times often determine how quickly operations can resume. A Severely Increased rating points to a credible risk of partial structural collapse, widespread equipment loss and hazardous-material release. Recovery timelines may extend for months.
Having examined electrical and tornadic shocks, we now consider hazards where repeated impact or ember exposure, rather than wind or water load, drives interruption risk.
Evaluating Impact Damage and Fire-Weather Escalation
Some hazards interrupt operations through cumulative pummeling rather than structural overload. Hail can cause thousands of localized impacts within minutes. Wildfire, by contrast, spreads damage through embers, smoke and forced shutdowns that affect grids and supply chains. Maintenance teams and continuity planners need visibility into these mechanisms. Physical damage may be limited, yet the resulting downtime costs can be substantial.
7. Hailstorm
When large hailstones strike, roof membranes can fracture, skylights can shatter and rooftop HVAC fins can deform. Subsequent rainfall may then infiltrate process areas. Solar panels, vehicle fleets and outdoor inventory are also vulnerable to direct damage. Dented sheet metal can accelerate corrosion and gradually compromise building envelopes.
Assessment combines regional hail climatology, expected stone diameters and storm frequency into return periods similar to wind metrics. Severe-convective fingerprints from climate models indicate that areas once known for pea-size hail now record more frequent golf-ball events, lengthening repair cycles and increasing the chance that repeat strikes occur before insurers finalize claims.
An Increased rating generally signals higher maintenance costs, including membrane repairs, module replacement and minor leak remediation. These issues are often resolved within several days. A Severely Increased rating points to more extensive damage. Roof replacements, widespread water ingress and damaged control electronics can extend interruptions for weeks. Seasonal reoccurrence may further delay recovery.
8. Wildfire
Wildfire risk extends well beyond the burn perimeter. Embers can travel kilometers ahead of a flame front to ignite pallets and packaging, while smoke particulates contaminate finished goods and force evacuations when air quality drops below safe-work thresholds. Utilities may proactively de-energize transmission lines, and authorities can close highways or rail corridors that feed critical inputs.
NASA cautions that “The potential future effects of global climate change include more frequent wildfires.” The agency links this trend to hotter, drier conditions that lengthen fire seasons and increase burn severity. Risk indices therefore combine fire-weather metrics, fuel-load mapping, slope profiles and defensible-space status. Together, these factors help measure both ignition probability and fire spread potential.
For operations, an Increased rating may mean occasional smoke incursions and brief utility disruptions, typically contained within a few days. A Severely Increased rating points to extended shutdowns even without direct flame damage – grid outages lasting weeks, restricted workforce access, disrupted logistics and accelerated equipment wear from ash infiltration.
From impact-driven and fire-weather hazards we turn to slower-moving stresses – cold, snow and water scarcity – that quietly erode throughput and resource security.
Evaluating Cold Stress and Water Scarcity
Prolonged freezes and multi-year precipitation deficits rarely dominate executive dashboards. Yet both can disrupt production, strain utilities and weaken supply-chain resilience. Their effects develop over days, weeks or even seasons rather than minutes. As a result, they are often overlooked in acute-event modeling, despite their potential to cause equally significant business interruption.
A multi-hazard framework explores how these slower variables interact with acute events. For instance, a frozen river can restrict fuel deliveries just as a cold-induced power outage curtails plant heating, compounding downtime.
9. Snow
Snow loads test structures, logistics and labor availability simultaneously. Flat roofs collect drift that can exceed design limits, while ice on pipe racks, instrumentation lines and cooling towers slows maintenance and raises failure rates. Outside the fence line, clogged roads, frozen rail switches and airport closures delay feedstocks, finished-goods shipments and critical spare parts.
Warming is driving heavier, wetter snowfall in some regions and more freeze-thaw cycles in others. Engineers may need to revisit roof load assumptions, drainage scupper sizing and de-icing protocols.
When a location earns an Increased snow rating, likely outcomes include short slowdowns, selective roof clearing and minor schedule slips. A Severely Increased rating implies a realistic risk of structural overstress, sustained power or gas curtailments and multi-day access constraints that ripple through staffing and logistics.
10. Drought
Industrial facilities depend on reliable water supplies for cooling, steam generation, pollution control and, in many cases, the product itself. Extended precipitation deficits can reduce river allocations, lower reservoir levels and limit water withdrawals. These constraints often emerge as rising temperatures increase process-cooling demand. Transportation networks can also be affected. Shallow waterways and heat-damaged rail or road infrastructure may disrupt both inbound raw materials and outbound product shipments.
The IPCC states that concurrent heatwaves and droughts have become more frequent and will intensify with further warming. Higher atmospheric evaporative demand accelerates agricultural and ecological drought even where rainfall trends are mixed, meaning modest precipitation declines can translate into severe water stress.
Under an Increased drought rating, operators may face tighter discharge permits, reduced cooling capacity and the need to truck in supplemental water. Production cuts may also last for weeks. A Severely Increased rating signals more persistent water scarcity. Organizations may face enforced rationing, rising utility costs, reduced power generation and potential regulatory shutdowns. These conditions can suppress output for an entire season or longer.
With seasonal cold and water scarcity addressed, we turn to chronic heat and humidity – slow-burn pressures that chip away at reliability, product quality and workforce safety if left unmitigated.
Evaluating Heat and Moisture Pressures on Operations
Surging average temperatures and shifting moisture regimes rarely trigger dramatic headlines yet they steadily erode equipment reliability, product quality and workforce capacity. For many operators these “slow variables” now cause more aggregate downtime than any single catastrophe.
A practical assessment therefore looks beyond temperature alone, integrating humidity, heat-index thresholds, grid stability and indoor-air controls. It also checks how chronic stress raises maintenance demand and speeds up asset depreciation.
11. High Temperature and Heatwave
Ambient temperature influences every thermodynamic process on site. As readings climb, cooling towers lose efficiency, compressors derate and electrical components approach design limits. Worker heat-stress rules shorten shifts or trigger production pauses, and regional grids face peak demand spikes that elevate blackout risk.
IPCC findings show that even a half-degree rise in global temperature can make extreme heat statistically significant at regional scales. As a result, a historical 1-in-20-year maximum may occur multiple times within a decade. Ratings are based on threshold-exceedance days, duration metrics such as consecutive hours above 35°C and forward-looking scenarios that reflect local warming trajectories.
An Increased heatwave rating points to more frequent throughput reductions during afternoon peak temperatures. It may also lead to higher chiller maintenance costs and targeted equipment upgrades. A Severely Increased rating indicates more persistent operational challenges. These can include routine production throttling, extended periods when outdoor work is unsafe, elevated fire risk and prolonged shutdowns caused by utility load-shedding requirements.
12. Humidity
Moisture content dictates corrosion rates, product spoilage risk and the stability of electronic controls. High relative humidity fosters condensation inside motor windings and switchgear, while low humidity raises electrostatic-discharge potential in cleanrooms and packaging lines.
Evaluation blends absolute and relative humidity statistics, seasonal persistence and micro-climate influences such as nearby cooling ponds. Many regions will experience higher moisture loads even without significant increases in rainfall. As a result, facilities may need greater conditioning capacity to keep indoor environments within specification.
With an Increased humidity rating, operators may need more frequent repainting, additional desiccant or HVAC capacity and occasional product-quality holds. A Severely Increased rating points to more persistent challenges. These conditions can include chronic condensation, uncontrolled static discharge, microbial growth, higher scrap rates and downtime driven by environmental remediation rather than visible structural damage.
These heat and moisture findings highlight a broader reality. Industrial risk can no longer be viewed through a flood-and-wind lens alone. A comprehensive, multi-hazard perspective is essential for understanding how climate-driven threats interact and shape operational resilience.
What a Full-Spectrum Hazard Review Should Change Next
A facility that prepares only for floods or windstorms risks missing the bigger picture. Multiple hazards are intensifying at the same time, and their business interruption effects can compound across assets, utilities, access routes and supply chains. A pump house flooded by rising river water may fail just as a heatwave strain cooling towers. At the same time, a regional wildfire could threaten incoming power. Grasping those overlaps is the essence of resilience.
If you’d like actionable insight into your organization’s complete risk profile, contact us at Sigma7 for a Climate Change Impact Report or a tailored risk-assessment consultation. Together we can turn the complexities of climate risk into clear priorities and measurable resilience gains.


